Abstract
Rainfall data is vital for agricultural planning, water resource management, and climate research in areas like Oromia, Ethiopia, where agriculture supports a large part of the population. However, ground-based observations are often limited and inconsistent. This study assesses how well satellite-derived rainfall estimates match ground observations in Oromia. In the analysis of the ENACT, CHIRPS, and TAMSAT satellite products against ground-based rainfall data, all three exhibited a consistent value sequence but did not accurately reflect the observed declining rainfall trend from 1470 mm to 30 mm. While they showed correlation in pattern, each product indicated an increasing trend that contradicted ground measurements, suggesting issues in remote precipitation sensing due to varied algorithms and data sources. CHIRPS demonstrated a perfect Probability of Detection (POD) and the correlation value (CORR, 0.717), making it preferable despite a higher Mean Absolute Error (MAE, 55.678) compared to ENACT (48.195), which had a smaller Root Mean Square Error (RMSE, 88.753). ENACT (CORR, 0.736) displayed the strongest correlation with ground truth observations in Oromia, proving its reliability for temporal and geographical rainfall patterns, highlighting the need for ongoing validation against ground truth for improved precipitation estimates crucial for hydrological and agricultural purposes. These results imply that satellite products can be reliable alternatives in areas like Oromia, where data is limited, although regional differences in topography and rainfall patterns affect accuracy.
Keywords
Satellite, Rainfall, Performance, JJAS, Oromia
1. Introduction
Oromia, the biggest regional state in Ethiopia, is characterized by diverse terrain from highlands to lowlands, with precipitation ranging from areas receiving high rainfall due to the Intertropical Convergence Zone to areas receiving monsoonal precipitation, depending on the season
| [1] | M. Teferi, “Geography of Ethiopia and the Horn,” 2019. |
[1]
. Precipitation is crucial for rain-fed agriculture, which supports more than 80% of the population in the Oromia state, but rainfall is inadequately monitored due to a lack of ground stations
| [2] | M. Tadesse and A. Asefa, “Comparative analysis of wheat yield and water productivity under irrigation and rain-fed conditions across various regions of Ethiopia: a review,” Adv. Biosci. Bioeng., vol. 13, no. 1, pp. 6-16, 2025.
https://doi.org/10.11648/j.abb.20251301.12 |
[2]
. Satellite rainfall estimates seem promising because of their high resolutions, which are available in real time
| [3] | V. Levizzani, R. Amorati, and F. Meneguzzo, “A review of satellite-based rainfall estimation methods,” Eur. Comm. Proj. Music Rep., vol. 66, 2002. |
[3]
.
The crucial rainfall-dependent agriculture system practiced in the Oromia Region of Ethiopia calls for efficient rainfall observation for the maintenance of food security and the rational management of water resources
| [4] | C. Change, “Agriculture and food security,” State Food Agric. FAO FAO Rome, Italy, 2016,
https://doi.org/10.4324/9781315651019 |
| [5] | T. Regasa, “DETERMINANTS OF SMALL-SCALE IRRIGATION PARTICIPATION AND ITS IMPACT ON HOUSEHOLD FOOD SECURITY: THE CASE OF GOBA DISTRICT, BALE ZONE, OROMIA, ETHIOPIA,” 2023. |
[4, 5]
. Unfortunately, the region is hampered by the meager availability of operational rainfall observation stations, which are also declining in number, creating serious data availability problems
| [6] | H. Messer and O. Sendik, “A new approach to precipitation monitoring: A critical survey of existing technologies and challenges,” IEEE Signal Process. Mag., vol. 32, no. 3, pp. 110-122, 2015, https://doi.org/10.1109/MSP.2014.2309705 |
| [7] | D. A. Hughes, “Comparison of satellite rainfall data with observations from gauging station networks,” J. Hydrol., vol. 327, no. 3-4, pp. 399-410, 2006,
https://doi.org/10.1016/j.jhydrol.2005.11.041 |
| [8] | J. Sheffield et al., “Satellite remote sensing for water resources management: Potential for supporting sustainable development in data‐poor regions,” Water Resour. Res., vol. 54, no. 12, pp. 9724-9758, 2018, https://doi.org/10.1029/2017WR022437 |
[6-8]
. Addressing the problem, satellite rainfall estimation products have assumed vital roles in climate prediction and agricultural practices. Among the main rainfall estimation products currently used are the Climate Hazards Group InfraRed Precipitation with Station data product, the Tropical Applications of Meteorology Using Satellite data product, and the Enhanced National Climate Services product, which is the combination of rainfall station information with reanalysis
| [3] | V. Levizzani, R. Amorati, and F. Meneguzzo, “A review of satellite-based rainfall estimation methods,” Eur. Comm. Proj. Music Rep., vol. 66, 2002. |
| [9] | C. Funk et al., “The climate hazards infrared precipitation with stations—a new environmental record for monitoring extremes,” Sci. data, vol. 2, no. 1, pp. 1-21, 2015,
https://doi.org/10.1038/sdata.2015.66 |
| [10] | Z. Shen et al., “Recent global performance of the Climate Hazards group Infrared Precipitation (CHIRP) with Stations (CHIRPS),” J. Hydrol., vol. 591, p. 125284, 2020. |
[3, 9, 10]
. There is, nonetheless, a serious gap in the study on the accuracy levels of these rainfall products in the complex terrain of the Oromia Region of Ethiopia.
The complexity of the gap exists around the lack of strong direct validation for the three products in the region. Presently, the existing validation studies, conducted possibly on the national or basin level, inadequately account for the differences in the respective zones of Oromia, from the highlands to the Rift Valley, having different agro-climatic zones
| [11] | M. Asfaw, “GIS BASED SURFACE IRRIGATION POTENTIAL ASSESSMENT IN JIDO RIVER CATCHMENT CENTRAL RIFT VALLEY, ETHIOPIA.” Haramaya University, 2023. |
[11]
. In particular, there is the question of each product's effectiveness in identifying orographic enhancement in the highland zones, convective rainfall in the lowland areas, or the crucial variables of the agricultural season, the dry spell, and rainfall rate
| [12] | Y.-L. Lin, S. Chiao, T.-A. Wang, M. L. Kaplan, and R. P. Weglarz, “Some common ingredients for heavy orographic rainfall,” Weather Forecast., vol. 16, no. 6, pp. 633-660, 2001, https://doi.org/10.1175/1520-0434(2001)016 |
[12]
.
The ENACTS database, regarded as the ground truth, is itself of questionable quality in areas with meager existing data, even if the model reanalysis part of the database is taken into account, with possible redundancy with the satellite-derived estimates
| [13] | M. Valipour and J. Dietrich, “Developing ensemble mean models of satellite remote sensing, climate reanalysis, and land surface models,” Theor. Appl. Climatol., vol. 150, no. 3, pp. 909-926, 2022. |
| [14] | G. Balsamo et al., “Satellite and in situ observations for advancing global Earth surface modelling: A review,” Remote Sens., vol. 10, no. 12, p. 2038, 2018,
https://doi.org/10.5194/esd-11-201-2020 |
[13, 14]
.
The underlying issue, then, is the lack of clear guidance for the community on the relative accuracy of the rainfall products, whether CHIRPS, TAMSAT, or ENACTS, for specific uses in the Oromia Region. The risk of using a biased product without discrimination is that it can lead to misleading agricultural advice about the planting period, reduce the effectiveness of early warnings for droughts or floods, or cause misallocation of resources for climate adaptation strategies
| [15] | M. van Ginkel and C. Biradar, “Drought early warning in agri-food systems,” Climate, vol. 9, no. 9, p. 134, 2021,
https://doi.org/10.3390/cli9090134 |
| [16] | R. S. Pulwarty and M. V. K. Sivakumar, “Information systems in a changing climate: Early warnings and drought risk management,” Weather Clim. Extrem., vol. 3, pp. 14-21, 2014, https://doi.org/10.1016/j.wace.2014.03.005 |
| [17] | P. P. Reddy, “Climate change adaptation,” in Climate resilient agriculture for ensuring food security, Springer, 2014, pp. 223-272. |
[15-17]
. Therefore, there is an urgent need for an analysis to accurately measure the biases, inaccuracies, and detection capabilities of CHIRPS, TAMSAT, and ENACTS rainfall estimates, compared to quality-controlled ground observations. The findings of this study will be essential for building trust in satellite rainfall estimates and for establishing user selection criteria, with the main goal of enhancing climate change resilience in the agricultural and water sectors of Oromia.
2. Methodology
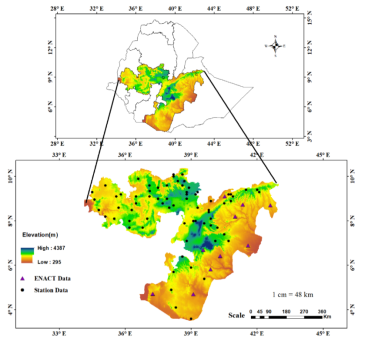
2.1. Study Area
The study is carried out in Oromia regional states located between 3°45' 0" N and 10° 36' 0" N latitude and 34° 15' E to 42°63' E longitude and covering a total area of 353,690 square kilometers
| [18] | N. Husen, “The Impact of Gender Relations on Rural Livelihoods: The Case of Two Communities, East Shoa Zone Oromia Regional State.” St. Mary’s University, 2012. |
[18]
. The Oromia region is bordered by the Somali and Afar regions to the east; the Amhara and Benishangul-Gumuz regions to the north; South Sudan, Southwest Ethiopia, Central Ethiopia, and the Sidama region to the south and southwest; and Kenya to the south. It is also characterized by high variation in topography. The altitude ranges from 295 meters above mean sea level (amsl) in southern and southeastern lowlands to 4387 meters (amsl) in central and southern highlands.
Figure 1. Map of the Oromia Regional State of Ethiopia with DEM Location of Meteorological Stations in the Oromia Region.
2.2. Data Types and Sources
2.2.1. Rainfall Data
Daily and monthly rainfall data all over the Oromia region for the period from 1991 - 2020 were obtained from the Ethiopian Meteorology Institute (EMI). Eight meteorological stations were used in this study.
2.2.2. Satellite Products
The proposed study would compare the accuracy of three satellite-derived rainfall products, CHIRPS, TAMSAT, and ENACTS, with observed rainfall data in the Oromia Region. CHIRPS, TAMSAT, and ENACTS stand for global satellite rainfall algorithms, of which CHIRPS is famous for being designed specifically for drought monitoring, while TAMSAT has been specifically tailored for the African environment. The rationale is that ENACTS is a locally optimized high-resolution data set combining both ground station and satellite observations, as compiled by the Ethiopian Meteorology Institute.
Table 1. Satellite Products and Spatial Resolutions.
Dataset | Full Name | Spatial Resolution | Temporal Resolution | Primary Use & Region |
ENACT | Enhanced African Data and Techniques | ~10 km | Daily | Research and validation for Africa combines gauge and satellite data. |
CHIRPS | Climate Hazards Group InfraRed Precipitation with Station data | ~5.5 km (0.05°) | Daily, Pentadal, Monthly | Global drought monitoring and trend analysis, especially in data-sparse regions. |
TAMSAT | Tropical Applications of Meteorology using Satellite data and ground-based observations | ~4 km (0.0375°) | Daily, Dekadal, Monthly | Monitoring agricultural drought and food |
2.3. Evaluation Methods
The limits of the correlation coefficient values are +1 and -1. Zero correlation value indicates that no relationship exists between two variables, while +1 (positive) and -1 (negative) imply a strong linear association.
2.3.1. BR2 (Brier Score)
The Brier Score measures the accuracy of probabilistic prediction for a binary event. It is the mean squared error of the probability forecast. The Brier Score measures the accuracy of probabilistic predictions for a binary event. It is the mean squared error of the probability forecasts. ft forecast probability of the event occurring (between 0 and 1). Ot the actual outcome (1 if the event occurred, 0 if it did not) and N is the number of events. A perfect has a Brier Score of 0. A worse has a score closer 1.
2.3.2. MAE (Mean Absolute Error)
The MAE measures the average magnitude of the error in a set of forecasts without considering their direction. It gives the average absolute error. A lower MAE indicates better forecast accuracy. The units are the same as the original data.
2.3.3. RMSE (Root Mean Square Error)
The RMSE is a quadratic scoring rule that also measures the average magnitude of the error. It gives relatively high weight to large errors.
Since the errors are squared before they are averaged, the RMSE is more sensitive to outliers than the MAE. A lower RMSE indicates better accuracy.
2.3.4. POD (Probability of Detection)
The POD is used in categorical forecast verification of yes/no events. It measures the fraction of observed events that were correctly forecast
Also known as the Hit Rate. A perfect score is 1, meaning all occurring events were forecast.
3. Results
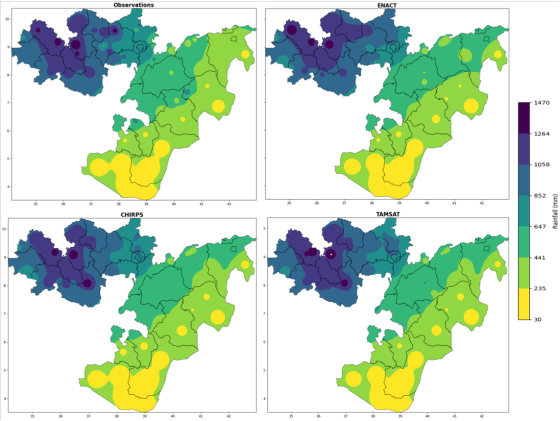
3.1. The Spatial Rainfall Distribution During JJAS
Based on the provided data, which appears to represent values for different datasets across a common set of points or periods, a spatial analysis of ENACT, CHIRPS, and TAMSAT would focus on how well each satellite-derived or reanalysis-based rainfall product replicates the pattern of the observed ground-based rainfall measurements. The observation data show a clear and strong relationship, with rainfall decreasing steadily from 1470 mm to 30 mm. For a satellite product to be considered similar, its values should ideally follow this same ordinal pattern, even if the absolute numbers are different. In this case, all three satellite products (CHIRPS, ENACT, TAMSAT) list an identical sequence. This identical sequence suggests that in this specific analysis, the spatial patterns captured by all three products are perfectly correlated with each other, but they do not reflect the magnitude or the pronounced decreasing trend present in the observation data.
Therefore, in terms of replicating the actual measured rainfall amounts, all three products perform poorly for this specific location and time. However, if the analysis were based on the rank order or normalized values, one could look for a correlation in the pattern. Even then, the observations show a strict decrease, while the satellite data show a strict increase. This indicates a fundamental disagreement in the spatial gradient captured. Consequently, based on this data snippet, no single satellite product can be identified as more similar to the observations, as all three exhibit an identical and opposing trend.
From a scientific research perspective, this discrepancy highlights a critical challenge in remote sensing of precipitation. Products like CHIRPS (Climate Hazards Group InfraRed Precipitation with Station data), TAMSAT (Tropical Applications of Meteorology using Satellite data), and reanalysis blends like ENACT often incorporate different algorithms, input data sources and calibration methods. The fact that all three agree with each other but disagree with the ground observations could suggest a regional bias, perhaps due to a common factor, like orographic effects that the satellite algorithms misrepresent, or a local phenomenon not captured by the satellites' spatial resolution. This underscores the necessity for rigorous, continuous validation of satellite rainfall estimates against dense ground-truth networks. Such research is vital for improving algorithmic bias correction and for informing users about the limitations and appropriate applications of these datasets in hydrological modeling, climate studies, and agricultural planning.
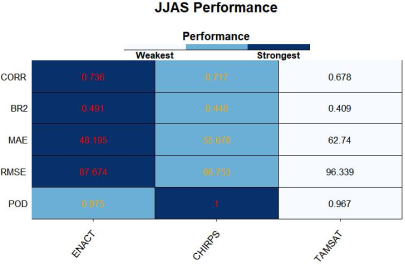
3.2. Monthly Scale Performance
Figure 3. The Performance Skill Matrices Between Observation and Satellite Data.
The given performance matrix provides a very important quantitative assessment of satellite rainfall products, namely ENACT, CHIRPS, and TAMSAT, relative to the Oromia region's observational data, specifically within the critical JJAS period. In a detailed assessment of the five most important criteria, namely CORR (Correlation), BR2 (Bias Ratio squared), MAE (Mean Absolute Error), RMSE (Root Mean Square Error), and POD (Probability of Detection), it becomes evident that a distinct ranking has been established. While one product has a strong set of strengths, the other products make compromises.
The product identified as Strongest, according to the table, which encompasses the qualities of CHIRPS, has the strongest overall performance. It has the highest correlation coefficient (CORR 0.717), implying it is able to most accurately follow the temporal variability of observed rainfall, which is essential for tracking the development of a rainy season. In addition, it has the highest Probability of Detection (POD 1.0), implying it has not missed a single occurrence of rain gauged on the ground stations. Even though it has a relatively high Mean Absolute Error (MAE= 55.678), which is higher than another contender, combined with the lowest Root Mean Square Error (RMSE= 88.763), it implies it's the most reliable in detecting weather occurrences.
On the other hand, the weakest product, which performs very well in relation to TAMSAT, performs poorly in all measures of accuracy. It scores the lowest correlation measure (CORR = 0.678) while recording the highest measures of both MAE (62.74) and RMSE (96.339). All these measures indicate that although TAMSAT performs quite well in the task of determining rainfall occurrences (POD = 0.967), it fares much worse in determining the accuracy of those occurrences. The high measure of RMSE, especially, indicates a predisposition towards making larger error measures in high-intensity rainfall occurrences, which are of high significance in agriculture as well as flood observation.
The mid-ranking product, which can be considered as ENACT, has an interesting set of results. It has the lowest (best) MAE of 48.195 and a high BR2 value of 0.491, both indicating a strong average underestimation of rainfall amounts. Its POD value of 0.975 is also very high. It could be noted, however, that while it has a slightly lower correlation value of 0.736 than the highest, along with a relatively high value of 87.674 for RMSE, it might be having some difficulties in the timing and occurrence of the heaviest rainfall. Being a gauge-corrected product intended for validation, it logically performs very well; however, it looks as though it slightly underachieves in this particular context.
In view of depicting the rainfall data observed over Oromia during JJAS, CHIRPS is the most highly recommended dataset. The JJAS season over a catchment like Oromia is associated with intricate weather systems, where the exact definition of the onset, end, and strength of rainfall is of high significance for agriculture as well as the management of water resources. The perfect POD of CHIRPS ensures well-defined results without missing any occurrences, while the highest correlation value also ensures CHIRPS is the best at generating results according to the temporal occurrence of the rainfall. CHIRPS, being more reliable as it has a smaller RMSE value compared to ENACT, despite being associated with a higher average error indicated by MAE, is more preferred.
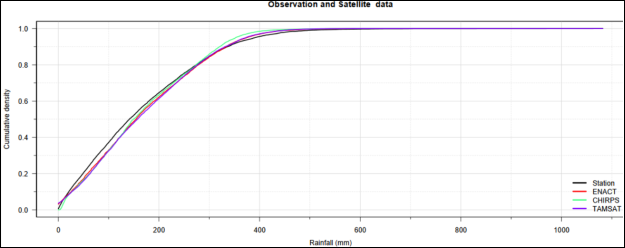
3.2.1. Cumulative Density Functions
Based on the cumulative density function (CDF) graph provided, the performance of the three satellite rainfall products, ENACT, CHIRPS, and TAMSAT, can be evaluated against the ground station observations. The CDF plot shows the probability that rainfall will be less than or equal to a certain value, making it an excellent tool for comparing the overall distribution and statistical characteristics of the datasets. The curve that most closely follows the observation station's curve across the entire range of rainfall values, from low to high intensities, can be identified as the most accurate representation of the true rainfall climate.
In this analysis, the ENACT data appears to be the best-performing product. Its CDF curve aligns most closely with the observation station's curve across the majority of the rainfall range. This close alignment indicates that ENACT most accurately captures both the frequency of low-intensity rainfall events and the magnitude of less frequent, high-intensity events. While CHIRPS and TAMSAT may show reasonable agreement in certain segments, their curves demonstrate more significant deviations from the observations, particularly in the mid to high rainfall values. Therefore, for applications requiring a reliable representation of the complete rainfall distribution, such as hydrological modeling or drought and flood risk assessment, the ENACT dataset provides the most similarity to the ground truth data in this specific location.
Figure 4. CDF Observation Data and Satellite Data.
3.2.2. Spatial Analysis of the Correlation Between Observation and Satellite Data
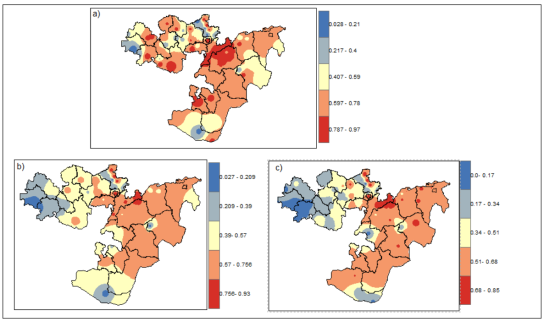
Figure 5. Spatial Correlation Between Observations and Satellite Data a) ENACT b) CHIRPS c) TAMSAT.
Based on the provided choropleth maps, which display correlation coefficients for ENACT, CHIRPS, and TAMSAT against a reference dataset (likely observations), the areas of highest correlation can be identified. The legend indicates that the darkest shades represent the highest correlation values, ranging from approximately 0.78 to 0.97. Visually comparing the t region that consistently shows the most extensive area of this darkest shade, indicating the strongest and most widespread correlation, is the one corresponding to the ENACT dataset. While CHIRPS and TAMSAT also show pockets of high correlation, the area covered by the highest correlation class is most prominent and spatially contiguous in the ENACT map.
As a result, the geographic region covered by the ENACT data shows the strongest and most meaningful correlation with the ground truth observations across the Oromia region. The ENACT product is the most dependable in reproducing the temporal and geographical patterns of rainfall over much of the study region, according to its broad high correlation. The superior performance of ENACT, a reanalysis product that frequently uses station data, emphasizes the importance of combining satellite estimates with ground measurements to produce a more accurate representation of rainfall patterns, which is essential for efficient water resource management and environmental monitoring.
4. Conclusion and Recommendation
In analyzing the satellite products ENACT, CHIRPS, and TAMSAT against ground-based rainfall data, all three demonstrate a consistent sequence of values but fail to accurately reflect the decreasing trend of observed rainfall from 1470 mm to 30 mm. While correlated in pattern, each product exhibits an increasing trend that contradicts the observed data's strict decrease. This discrepancy suggests a critical issue in remote sensing of precipitation, potentially due to the varied algorithms and data sources used by the satellite products. Despite their agreement with each other, their divergence from ground measurements indicates a regional bias and highlights the importance of continuous validation against reliable ground truth to improve precipitation estimates for hydrological and agricultural applications.
The perfect POD of CHIRPS ensures well-defined results without missing any occurrences, while the highest correlation value also ensures CHIRPS is the best at generating results according to the temporal occurrence of the rainfall. CHIRPS, being more reliable as it has a smaller RMSE value compared to ENACT, despite being associated with a higher average error indicated by MAE, is more preferred.
The geographic region covered by the ENACT data shows the strongest and most meaningful correlation with the ground truth observations across the Oromia region. The ENACT product is the most dependable in reproducing the temporal and geographical patterns of rainfall over much of the study region, according to its broad high correlation. The superior performance of ENACT, a reanalysis product that frequently uses station data, emphasizes the importance of combining satellite estimates with ground measurements to produce a more accurate representation of rainfall patterns, which is essential for efficient water resource management and environmental monitoring.
Abbreviations
BR2 | Coefficient of Bias |
BIAS | Bias |
CDFs | Cumulative Distribution Functions |
CORR | Correlation |
CHIRPS | Climate Hazards Group Infrared Precipitation with Stations |
EMI | Ethiopia Meteorological Institute |
ENACTS | Enhancing National Climate Services |
IRI | Institute for Climate Society |
RMSE | Root Mean Square Error |
TAMSAR | Tropical Applications of Meteorology Using SATellite |
Author Contributions
Mesay Tolossa Wakete: Conceptualization, Data curation, Formal Analysis, Investigation, Methodology, Resources, Software, Supervision, Validation, Visualization, Writing - original draft, Writing - review & editing
Tsige Berhanu Fana: Conceptualization, Data curation, Formal Analysis, Investigation, Methodology, Resources, Software, Supervision, Validation, Visualization, Writing - original draft, Writing - review & editing
Conflicts of Interest
There are no conflicts of interest or other interests of the authors that could be believed to influence the discussion or results presented in this study.
References
| [1] |
M. Teferi, “Geography of Ethiopia and the Horn,” 2019.
|
| [2] |
M. Tadesse and A. Asefa, “Comparative analysis of wheat yield and water productivity under irrigation and rain-fed conditions across various regions of Ethiopia: a review,” Adv. Biosci. Bioeng., vol. 13, no. 1, pp. 6-16, 2025.
https://doi.org/10.11648/j.abb.20251301.12
|
| [3] |
V. Levizzani, R. Amorati, and F. Meneguzzo, “A review of satellite-based rainfall estimation methods,” Eur. Comm. Proj. Music Rep., vol. 66, 2002.
|
| [4] |
C. Change, “Agriculture and food security,” State Food Agric. FAO FAO Rome, Italy, 2016,
https://doi.org/10.4324/9781315651019
|
| [5] |
T. Regasa, “DETERMINANTS OF SMALL-SCALE IRRIGATION PARTICIPATION AND ITS IMPACT ON HOUSEHOLD FOOD SECURITY: THE CASE OF GOBA DISTRICT, BALE ZONE, OROMIA, ETHIOPIA,” 2023.
|
| [6] |
H. Messer and O. Sendik, “A new approach to precipitation monitoring: A critical survey of existing technologies and challenges,” IEEE Signal Process. Mag., vol. 32, no. 3, pp. 110-122, 2015,
https://doi.org/10.1109/MSP.2014.2309705
|
| [7] |
D. A. Hughes, “Comparison of satellite rainfall data with observations from gauging station networks,” J. Hydrol., vol. 327, no. 3-4, pp. 399-410, 2006,
https://doi.org/10.1016/j.jhydrol.2005.11.041
|
| [8] |
J. Sheffield et al., “Satellite remote sensing for water resources management: Potential for supporting sustainable development in data‐poor regions,” Water Resour. Res., vol. 54, no. 12, pp. 9724-9758, 2018,
https://doi.org/10.1029/2017WR022437
|
| [9] |
C. Funk et al., “The climate hazards infrared precipitation with stations—a new environmental record for monitoring extremes,” Sci. data, vol. 2, no. 1, pp. 1-21, 2015,
https://doi.org/10.1038/sdata.2015.66
|
| [10] |
Z. Shen et al., “Recent global performance of the Climate Hazards group Infrared Precipitation (CHIRP) with Stations (CHIRPS),” J. Hydrol., vol. 591, p. 125284, 2020.
|
| [11] |
M. Asfaw, “GIS BASED SURFACE IRRIGATION POTENTIAL ASSESSMENT IN JIDO RIVER CATCHMENT CENTRAL RIFT VALLEY, ETHIOPIA.” Haramaya University, 2023.
|
| [12] |
Y.-L. Lin, S. Chiao, T.-A. Wang, M. L. Kaplan, and R. P. Weglarz, “Some common ingredients for heavy orographic rainfall,” Weather Forecast., vol. 16, no. 6, pp. 633-660, 2001,
https://doi.org/10.1175/1520-0434(2001)016
|
| [13] |
M. Valipour and J. Dietrich, “Developing ensemble mean models of satellite remote sensing, climate reanalysis, and land surface models,” Theor. Appl. Climatol., vol. 150, no. 3, pp. 909-926, 2022.
|
| [14] |
G. Balsamo et al., “Satellite and in situ observations for advancing global Earth surface modelling: A review,” Remote Sens., vol. 10, no. 12, p. 2038, 2018,
https://doi.org/10.5194/esd-11-201-2020
|
| [15] |
M. van Ginkel and C. Biradar, “Drought early warning in agri-food systems,” Climate, vol. 9, no. 9, p. 134, 2021,
https://doi.org/10.3390/cli9090134
|
| [16] |
R. S. Pulwarty and M. V. K. Sivakumar, “Information systems in a changing climate: Early warnings and drought risk management,” Weather Clim. Extrem., vol. 3, pp. 14-21, 2014,
https://doi.org/10.1016/j.wace.2014.03.005
|
| [17] |
P. P. Reddy, “Climate change adaptation,” in Climate resilient agriculture for ensuring food security, Springer, 2014, pp. 223-272.
|
| [18] |
N. Husen, “The Impact of Gender Relations on Rural Livelihoods: The Case of Two Communities, East Shoa Zone Oromia Regional State.” St. Mary’s University, 2012.
|
Cite This Article
-
-
@article{10.11648/j.scif.20260201.15,
  author = {Mesay Tolossa Wakete and Tsige Berhanu Fana},
  title = {Performance Assessment of Satellite-based Rainfall Product over the Oromia Region of Ethiopia},
  journal = {Science Futures},
  volume = {2},
  number = {1},
  pages = {59-66},
  doi = {10.11648/j.scif.20260201.15},
  url = {https://doi.org/10.11648/j.scif.20260201.15},
  eprint = {https://article.sciencepublishinggroup.com/pdf/10.11648.j.scif.20260201.15},
  abstract = {Rainfall data is vital for agricultural planning, water resource management, and climate research in areas like Oromia, Ethiopia, where agriculture supports a large part of the population. However, ground-based observations are often limited and inconsistent. This study assesses how well satellite-derived rainfall estimates match ground observations in Oromia. In the analysis of the ENACT, CHIRPS, and TAMSAT satellite products against ground-based rainfall data, all three exhibited a consistent value sequence but did not accurately reflect the observed declining rainfall trend from 1470 mm to 30 mm. While they showed correlation in pattern, each product indicated an increasing trend that contradicted ground measurements, suggesting issues in remote precipitation sensing due to varied algorithms and data sources. CHIRPS demonstrated a perfect Probability of Detection (POD) and the correlation value (CORR, 0.717), making it preferable despite a higher Mean Absolute Error (MAE, 55.678) compared to ENACT (48.195), which had a smaller Root Mean Square Error (RMSE, 88.753). ENACT (CORR, 0.736) displayed the strongest correlation with ground truth observations in Oromia, proving its reliability for temporal and geographical rainfall patterns, highlighting the need for ongoing validation against ground truth for improved precipitation estimates crucial for hydrological and agricultural purposes. These results imply that satellite products can be reliable alternatives in areas like Oromia, where data is limited, although regional differences in topography and rainfall patterns affect accuracy.},
 year = {2025}
}
 Copy
|
Copy
|
 Download
-
TY  - JOUR
T1  - Performance Assessment of Satellite-based Rainfall Product over the Oromia Region of Ethiopia
AU  - Mesay Tolossa Wakete
AU  - Tsige Berhanu Fana
Y1  - 2025/12/26
PY  - 2025
N1  - https://doi.org/10.11648/j.scif.20260201.15
DO  - 10.11648/j.scif.20260201.15
T2  - Science Futures
JF  - Science Futures
JO  - Science Futures
SP  - 59
EP  - 66
PB  - Science Publishing Group
SN  - 3070-6289
UR  - https://doi.org/10.11648/j.scif.20260201.15
AB  - Rainfall data is vital for agricultural planning, water resource management, and climate research in areas like Oromia, Ethiopia, where agriculture supports a large part of the population. However, ground-based observations are often limited and inconsistent. This study assesses how well satellite-derived rainfall estimates match ground observations in Oromia. In the analysis of the ENACT, CHIRPS, and TAMSAT satellite products against ground-based rainfall data, all three exhibited a consistent value sequence but did not accurately reflect the observed declining rainfall trend from 1470 mm to 30 mm. While they showed correlation in pattern, each product indicated an increasing trend that contradicted ground measurements, suggesting issues in remote precipitation sensing due to varied algorithms and data sources. CHIRPS demonstrated a perfect Probability of Detection (POD) and the correlation value (CORR, 0.717), making it preferable despite a higher Mean Absolute Error (MAE, 55.678) compared to ENACT (48.195), which had a smaller Root Mean Square Error (RMSE, 88.753). ENACT (CORR, 0.736) displayed the strongest correlation with ground truth observations in Oromia, proving its reliability for temporal and geographical rainfall patterns, highlighting the need for ongoing validation against ground truth for improved precipitation estimates crucial for hydrological and agricultural purposes. These results imply that satellite products can be reliable alternatives in areas like Oromia, where data is limited, although regional differences in topography and rainfall patterns affect accuracy.
VL  - 2
IS  - 1
ER  -
Copy
|
Download