Rainfall data frequency analysis and probability distribution enable future extreme events. Determining the magnitude of an extreme rainfall event for a given probability level is crucial for constructing irrigation and other hydraulic systems. On Earth, rainfall is a rare but significant hydrological characteristic. The analysis was for one to three consecutive days of maximum annual rainfall using a variety of widely used probability distributions. In order to determine the best-fit probability distribution, daily rainfall data for Gimbi Town were taken from 1995 to 2019 and gathered from the Ethiopian Meteorological Institute (EMI). The chi-square (χ²) test was used to measure the goodness of fit between the expected and observed values. The chi-square value of the 1, 2 and 3-day maximum annual daily rainfall was 8.8, 3.8, and 5.4 respectively. Chow method was the best-fit probability distribution for predicting the annual 1 and 2-day maximum rainfall for various return periods and the log-Pearson type-III distribution was the best-fit probability distribution for predicting the annual 3-day maximum rainfall for various return periods. The results of this study would be useful for agricultural scientists, decision-makers, policy planners, and researchers for agricultural development and construction of small soil and water conservation structures, irrigation, and drainage systems in Gimbi Town, Ethiopia.
| Published in | Science Futures (Volume 1, Issue 1) |
| DOI | 10.11648/j.scif.20250101.19 |
| Page(s) | 70-83 |
| Creative Commons |
This is an Open Access article, distributed under the terms of the Creative Commons Attribution 4.0 International License (http://creativecommons.org/licenses/by/4.0/), which permits unrestricted use, distribution and reproduction in any medium or format, provided the original work is properly cited. |
| Copyright |
Copyright © The Author(s), 2025. Published by Science Publishing Group |
Chi-square Test, Gimbi, Gumbel, Rainfall, Return Period, Probability Distribution
Gimbi rainfall station | |||
|---|---|---|---|
Year | Annual Maximum Daily Rainfall in mm | ||
1 day | 2 days | 3 days | |
1995 | 40.2 | 79 | 101.1 |
1996 | 45 | 82.3 | 85.7 |
1997 | 55.2 | 97.2 | 98.3 |
1998 | 65.5 | 127.5 | 158.7 |
1999 | 62.4 | 85.2 | 118.8 |
2000 | 64.9 | 70 | 92.1 |
2001 | 65.9 | 96 | 96 |
2002 | 61.3 | 113.9 | 114.8 |
2003 | 79.7 | 114.2 | 120.5 |
2004 | 56.3 | 98.2 | 117.6 |
2005 | 56.8 | 101 | 113.6 |
2006 | 66.3 | 71.1 | 100.7 |
2007 | 116.8 | 137.6 | 141.5 |
2008 | 72.9 | 99.6 | 120.5 |
2009 | 47.7 | 71.7 | 95.2 |
2010 | 101.3 | 117 | 124.2 |
2011 | 64.3 | 80.4 | 95.9 |
2012 | 51.6 | 89.3 | 105.4 |
2013 | 69.9 | 101.4 | 114.6 |
2014 | 61.3 | 101.1 | 115.4 |
2015 | 72 | 112 | 131.6 |
2016 | 91.3 | 125.9 | 136.8 |
2017 | 54 | 80.9 | 89.1 |
2018 | 63.7 | 77.3 | 84 |
2019 | 50.2 | 80.9 | 89.1 |
S. No | Statistical parameters | Unit | One day | Two days | Three days |
|---|---|---|---|---|---|
1 | Total | mm | 1636.5 | 2410.7 | 2761.2 |
2 | Maximum | mm | 116.8 | 137.6 | 158.7 |
3 | Minimum | mm | 40.2 | 70 | 84 |
4 | Mean | mm | 65.5 | 96.4 | 110.4 |
5 | Standard deviation | mm | 17 | 19 | 19 |
6 | Coefficient of variation | % | 26 | 20 | 17 |
7 | Coefficient of skewness | - | 1.5 | 0.5 | 0.7 |
Return period (T) in year | Probability (P) in % | 1-day RF in mm | 2-day RF in mm | 3-day RF in mm |
|---|---|---|---|---|
5 | 20 | 77.9 | 110.1 | 124.1 |
10 | 10 | 88.1 | 121.2 | 135.2 |
25 | 4 | 100.9 | 135.2 | 149.2 |
50 | 2 | 110.4 | 145.7 | 159.7 |
100 | 1 | 119.8 | 156 | 170 |
Return period (T), in year | Cs= 0 read KT (from table) | Estimated rainfall in mm |
|---|---|---|
5 | 0.842 | 79.8 |
10 | 1.282 | 87.3 |
25 | 1.751 | 95.3 |
50 | 2.054 | 100.4 |
100 | 2.326 | 105.0 |
Return period (T) in years | = 65.5, when Cs= 1.5 Read KT (from table) | Estimated rainfall in mm |
|---|---|---|
5 | 0.690 | 77.7 |
10 | 1.333 | 88.6 |
25 | 2.146 | 102.3 |
50 | 2.743 | 112.3 |
100 | 3.330 | 122.1 |
X̅= 65.5 | |
|---|---|
Return period (T) in years | Estimated rainfall in mm |
5 | 77.9 |
10 | 88.1 |
25 | 100.9 |
50 | 110.4 |
100 | 119.8 |
Return period (T) in years | = 65.5, when Cs= 0.8 Read KT (From Table) | Estimated rainfall in mm |
|---|---|---|
5 | 0.780 | 79.0 |
10 | 1.336 | 88.6 |
25 | 1.993 | 100.0 |
50 | 2.453 | 107.9 |
100 | 2.891 | 115.5 |
Return period (T) year | Probability (P) % | Ro mm | Calculated Chi-square value | |||
|---|---|---|---|---|---|---|
LND | LPTIIID | GUMD | CHOW’S | |||
5 | 20 | 116.8 | 40.2 | 19.7 | 19.4 | 18.1 |
10 | 10 | 101.3 | 2.1 | 1.8 | 2.0 | 1.8 |
25 | 4 | 91.3 | 0.2 | 1.2 | 0.9 | 0.8 |
50 | 2 | 79.7 | 4.5 | 9.5 | 8.5 | 7.4 |
100 | 1 | 72.9 | 10.2 | 19.8 | 18.4 | 15.7 |
Mean | 11.4 | 10.4 | 9.8 | 8.8 | ||
Return period (T), in year | KT (From Table) | Estimated rainfall in mm |
|---|---|---|
5 | 0.842 | 112.4 |
10 | 1.282 | 120.8 |
25 | 1.751 | 129.7 |
50 | 2.054 | 135.4 |
100 | 2.326 | 140.6 |
Return period (T) in years | = 96.4, when Cs= 0.5 Read KT (From Table) | Estimated rainfall in mm |
|---|---|---|
5 | 0.808 | 111.8 |
10 | 1.323 | 121.5 |
25 | 1.910 | 132.7 |
50 | 2.311 | 140.3 |
100 | 2.686 | 147.4 |
X̅= 96.4 | |
|---|---|
Return period (T) in years | Estimated rainfall in mm |
5 | 110.1 |
10 | 121.2 |
25 | 135.2 |
50 | 145.7 |
100 | 156 |
Return period (T) in years | = 96.4, when Cs= 0.6 Read KT (From Table) | Estimated rainfall in mm |
|---|---|---|
5 | 0.800 | 111.6 |
10 | 1.328 | 121.6 |
25 | 1.939 | 133.2 |
50 | 2.359 | 141.2 |
100 | 2.755 | 148.7 |
Return period (T) Year | Probability (P) % | Ro mm | Calculated Chi-square value | |||
|---|---|---|---|---|---|---|
LND | LPTIIID | GUMD | CHOW | |||
5 | 20 | 137.6 | 17.61 | 6.0 | 6.9 | 6.1 |
10 | 10 | 127.5 | 0.37 | 0.3 | 0.3 | 0.3 |
25 | 4 | 125.9 | 0.11 | 0.3 | 0.6 | 0.4 |
50 | 2 | 117 | 2.50 | 3.9 | 5.7 | 4.1 |
100 | 1 | 114.2 | 4.96 | 7.5 | 11.2 | 8.0 |
Mean | 5.1 | 3.6 | 4.9 | 3.8 | ||
Return period (T), in year | KT (From Table) | Estimated rainfall in mm |
|---|---|---|
5 | 0.842 | 126.4 |
10 | 1.282 | 134.8 |
25 | 1.751 | 143.7 |
50 | 2.054 | 149.4 |
100 | 2.326 | 154.6 |
Return period (T) in years | = 110.4, when Cs= 0.7 Read KT (From Table) | Estimated rainfall in mm |
|---|---|---|
5 | 0.790 | 125.4 |
10 | 1.333 | 135.7 |
25 | 1.967 | 147.8 |
50 | 2.407 | 156.1 |
100 | 2.824 | 164.1 |
X̅= 110.4 | |
|---|---|
Return period (T) in years | Estimated rainfall in mm |
5 | 124.1 |
10 | 135.2 |
25 | 149.2 |
50 | 159.7 |
100 | 170 |
Return period (T) in years | = 110.4, when Cs= 0.5 Read KT (From Table) | Estimated rainfall in mm |
|---|---|---|
5 | 0.808 | 125.8 |
10 | 1.323 | 135.5 |
25 | 1.910 | 146.7 |
50 | 2.311 | 154.3 |
100 | 2.686 | 161.4 |
Return period (T) year | Probability (P) % | Ro mm | Calculated Chi-square value | |||
|---|---|---|---|---|---|---|
LND | LPTIIID | GUMD | CHOW’S | |||
5 | 20 | 137.6 | 6.7 | 1.2 | 1.5 | 1.1 |
10 | 10 | 127.5 | 0.4 | 0.5 | 0.4 | 0.5 |
25 | 4 | 125.9 | 2.2 | 3.2 | 3.6 | 2.9 |
50 | 2 | 117 | 7.0 | 9.8 | 11.4 | 9.0 |
100 | 1 | 114.2 | 10.6 | 15.2 | 18.3 | 13.8 |
Mean | 5.4 | 6.0 | 7.0 | 5.5 | ||
EV I | Extreme Value Type I |
LN | Log Normal |
LP III | Log-pearson Type III |
P | Probability |
RF | Rainfall |
T | Return Period |
X2 | Chi-square |
| [1] | A. Patel and R. K. Verma, “Probability analysis for prediction of annual maximum rainfall of one to five consecutive months for Sultanpur region,” Int. J. Agric. Sci., vol. 15, no. 1, pp. 15–24, 2019, |
| [2] | S. R. Bhakar, A. K. Bansal, and N. Chhajed, “Frequency Analysis of Consecutive Days Maximum Rainfall At Banswara, Rajasthan, India,” J. Inst. Eng. Agric. Eng. Div., vol. 1, no. 3, pp. 14–16, 2006. |
| [3] | S. S. Idate, D. M. Mahale, H. N. Bhange, and K. D. Gharde, “Frequency Analysis for One day to Six Consecutive Days of Annual Maximum Rainfall for Mulde, Dist: Sindhudurg,” Int. J. Curr. Microbiol. Appl. Sci., vol. 8, no. 02, pp. 3069–3075, 2019, |
| [4] | A. A. Awass, “Hydrological Drought Analysis-occurrence, severity, risks : the case of Wabi Shebele River Basin,” p. 220, 2009. |
| [5] | A. Fikru, “Frequency Analysis of Extreme Events and Developing Intensity Duration Frequency Curves: The Case of Jimma Town, Ethiopia,” J. Nat. Sci. Res., vol. 12, no. 21, pp. 14–24, 2021, |
| [6] | G. Mosisa, “Prediction of Consecutive Days Maximum Rainfall Using Frequency Analysis for Nekemte Town, Oromia, Ethiopia,” J. Water Resource. Ocean Sci., no. April, 2023, |
| [7] | P. M. Hodlur and R. V Raikar, “Probability Distribution and Frequency Analysis of Consecutive Days Maximum Rainfall at Sambra (Belagavi), Karnataka, India,” 2021, Available: |
| [8] | P. K. Bora, V. Ram, A. K. Singh, R. Singh, and S. M. Feroze, “Probable Annual Maximum Rainfall for Barapani, Meghalaya,” vol. 3, no. 1, pp. 16–18, 2012. |
| [9] | S. Bhakar et al., “Probability analysis of rainfall at Kota PROBABLITY ANALYSIS OF RAINFALL AT KOTA,” no. December, 2014, Available: |
| [10] | M. Manikandan, G. Thiyagarajan, and G. Vijayakumar, “Probability Analysis for Estimating Annual One Day Maximum Rainfall in Tamil Nadu Agricultural University,” Madras Agric. J., vol. 98, no. 1–3, pp. 69–73, 2011. |
| [11] | B. Singh, D. Rajpurohit, A. Vasishth, and J. Singh, “Probability analysis for estimation of annual one day maximum rainfall of Jhalarapatan Area of Rajasthan, India,” Plant Arch., vol. 12, no. 2, pp. 1093–1100, 2012. |
| [12] | R. M. Sabarish, R. Narasimhan, A. R. Chandhru, C. R. Suribabu, J. Sudharsan, and S. Nithiyanantham, “Probability analysis for consecutive-day maximum rainfall for Tiruchirapalli City (south India, Asia),” Appl. Water Sci., vol. 7, no. 2, pp. 1033–1042, 2017, |
| [13] | A. Kandpal, S. Kanwal, and A. Gosain, “Estimation of Consecutive Days Maximum Rainfall using Different Probability Distributions and Their Comparsion,” pp. 100–106, 2015. |
| [14] | A. Shering and A. Kumar, “Comparative Study of Prediction of Annual Maximum Rainfall By Using three Different Methods in Bijnor District (U. P.),” vol. 10, no. 9, pp. 33–41, 2017, |
| [15] | G. Mosisa, “Estimation of One to Two Consecutive Days Maximum Annual Rainfall Using Probability Distributions: The Case of Bedele Town, Oromia, Ethiopia,” Eng. Sci., vol. 8, no. 3, pp. 23–29, 2023, |
| [16] | Z. Al-houri, A. Al-omari, O. Saleh, and S. Centre, “Frequency Analysis of Annual One Day Maximum Rainfall at Amman Zarqa Basin, Jordan,” Civ. Environ. Res., vol. 6, no. 3, pp. 44–57, 2014. |
| [17] |
M. Barkotulla, M. R.-J. of D., and undefined 2009, “Characterization and frequency analysis of consecutive days maximum rainfall at Boalia, Rajshahi and Bangladesh,” vol. 1, no. 5, pp. 121–126, 2009, Available:
https://academicjournals.org/journal/JDAE/article-full-text-pdf/AC6BD373876 |
| [18] | M. Gundalia, “Monthly and Annual Maximum Rainfall Prediction using Best Fitted Probability Distributions in Junagadh Region (Gujarat- India),” 2022. |
APA Style
Mosisa, G. (2025). Probability Analysis for One Day to Three Consecutive Days of Annual Maximum Rainfall: The Case of Gimbi Town, Oromia Region, Ethiopia. Science Futures, 1(1), 70-83. https://doi.org/10.11648/j.scif.20250101.19
ACS Style
Mosisa, G. Probability Analysis for One Day to Three Consecutive Days of Annual Maximum Rainfall: The Case of Gimbi Town, Oromia Region, Ethiopia. Sci. Futures 2025, 1(1), 70-83. doi: 10.11648/j.scif.20250101.19
AMA Style
Mosisa G. Probability Analysis for One Day to Three Consecutive Days of Annual Maximum Rainfall: The Case of Gimbi Town, Oromia Region, Ethiopia. Sci Futures. 2025;1(1):70-83. doi: 10.11648/j.scif.20250101.19
@article{10.11648/j.scif.20250101.19,
  author = {Gemechu Mosisa},
  title = {Probability Analysis for One Day to Three Consecutive Days of Annual Maximum Rainfall: The Case of Gimbi Town, Oromia Region, Ethiopia},
  journal = {Science Futures},
  volume = {1},
  number = {1},
  pages = {70-83},
  doi = {10.11648/j.scif.20250101.19},
  url = {https://doi.org/10.11648/j.scif.20250101.19},
  eprint = {https://article.sciencepublishinggroup.com/pdf/10.11648.j.scif.20250101.19},
  abstract = {Rainfall data frequency analysis and probability distribution enable future extreme events. Determining the magnitude of an extreme rainfall event for a given probability level is crucial for constructing irrigation and other hydraulic systems. On Earth, rainfall is a rare but significant hydrological characteristic. The analysis was for one to three consecutive days of maximum annual rainfall using a variety of widely used probability distributions. In order to determine the best-fit probability distribution, daily rainfall data for Gimbi Town were taken from 1995 to 2019 and gathered from the Ethiopian Meteorological Institute (EMI). The chi-square (χ²) test was used to measure the goodness of fit between the expected and observed values. The chi-square value of the 1, 2 and 3-day maximum annual daily rainfall was 8.8, 3.8, and 5.4 respectively. Chow method was the best-fit probability distribution for predicting the annual 1 and 2-day maximum rainfall for various return periods and the log-Pearson type-III distribution was the best-fit probability distribution for predicting the annual 3-day maximum rainfall for various return periods. The results of this study would be useful for agricultural scientists, decision-makers, policy planners, and researchers for agricultural development and construction of small soil and water conservation structures, irrigation, and drainage systems in Gimbi Town, Ethiopia.},
 year = {2025}
}
TY  - JOUR
T1  - Probability Analysis for One Day to Three Consecutive Days of Annual Maximum Rainfall: The Case of Gimbi Town, Oromia Region, Ethiopia
AU  - Gemechu Mosisa
Y1  - 2025/12/11
PY  - 2025
N1  - https://doi.org/10.11648/j.scif.20250101.19
DO  - 10.11648/j.scif.20250101.19
T2  - Science Futures
JF  - Science Futures
JO  - Science Futures
SP  - 70
EP  - 83
PB  - Science Publishing Group
SN  - 3070-6289
UR  - https://doi.org/10.11648/j.scif.20250101.19
AB  - Rainfall data frequency analysis and probability distribution enable future extreme events. Determining the magnitude of an extreme rainfall event for a given probability level is crucial for constructing irrigation and other hydraulic systems. On Earth, rainfall is a rare but significant hydrological characteristic. The analysis was for one to three consecutive days of maximum annual rainfall using a variety of widely used probability distributions. In order to determine the best-fit probability distribution, daily rainfall data for Gimbi Town were taken from 1995 to 2019 and gathered from the Ethiopian Meteorological Institute (EMI). The chi-square (χ²) test was used to measure the goodness of fit between the expected and observed values. The chi-square value of the 1, 2 and 3-day maximum annual daily rainfall was 8.8, 3.8, and 5.4 respectively. Chow method was the best-fit probability distribution for predicting the annual 1 and 2-day maximum rainfall for various return periods and the log-Pearson type-III distribution was the best-fit probability distribution for predicting the annual 3-day maximum rainfall for various return periods. The results of this study would be useful for agricultural scientists, decision-makers, policy planners, and researchers for agricultural development and construction of small soil and water conservation structures, irrigation, and drainage systems in Gimbi Town, Ethiopia.
VL  - 1
IS  - 1
ER  -
Department of Hydraulic and Water Resources Engineering, Wallaga University, Nekemte, Ethiopia
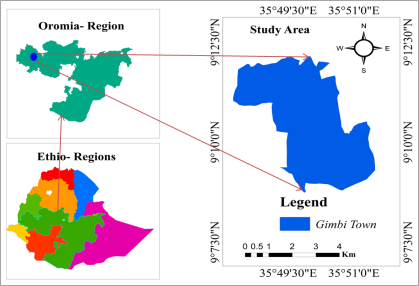
Figure 1. Location map of the study.
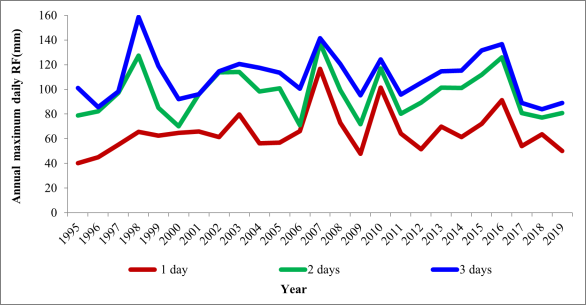
Figure 2. Graph of consecutive annual maximum daily rainfall data for 25 years for Gimbi town.
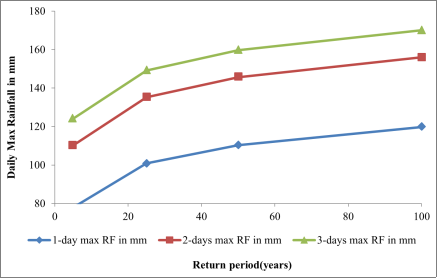
Figure 3. Maximum rainfall for various return periods.
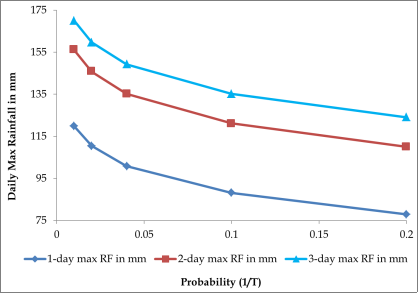
Figure 4. Variation of observed 1 day and 2 to 3 days consecutive Maximum Rainfall with probability.
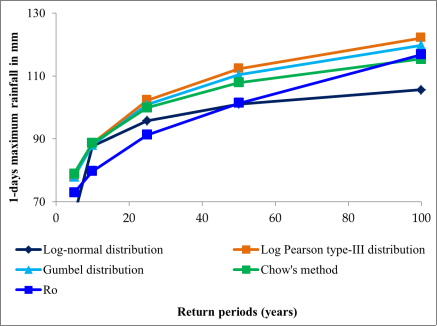
Figure 5. One-day maximum rainfall based on various probability functions.
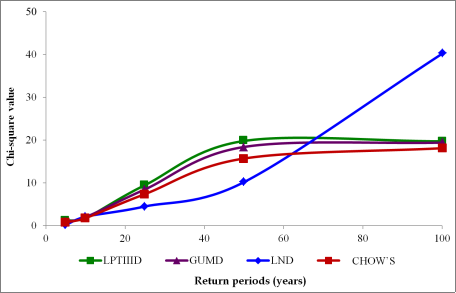
Figure 6. X2 Value versus return periods for selected probability functions.
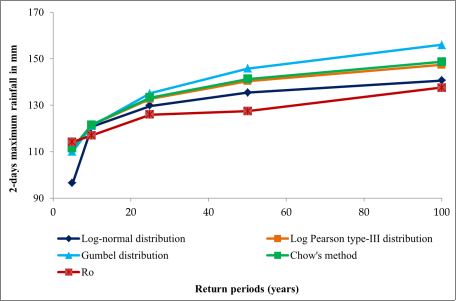
Figure 7. Two days maximum rainfall based on various probability functions.
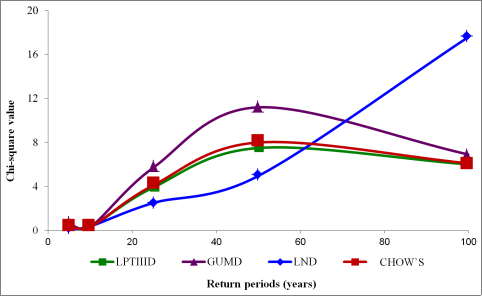
Figure 8. X2 Value versus return periods for selected probability functions.
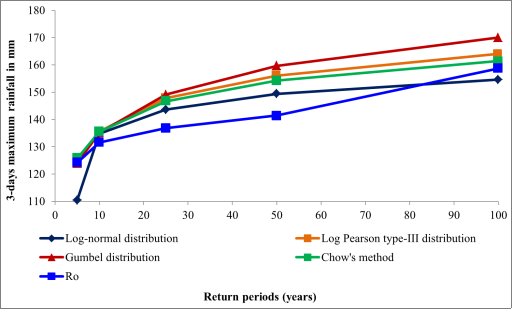
Figure 9. Three days maximum rainfall based on various probability functions.
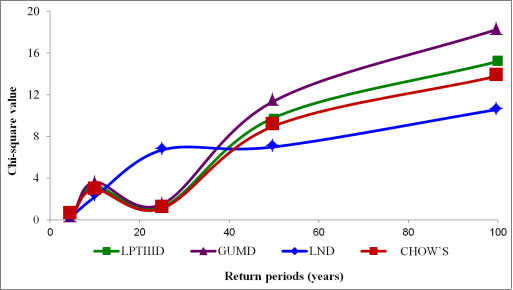
Figure 10. X2 Value versus return periods for selected probability functions.